
As an Amazon Associate, I earn from qualifying purchases.
In this article 8 sections
- The Three Pathways From Ocean Temperature to Weather
- Sea Surface Temperature: What It Is and How It Is Measured
- ENSO: The Primary Ocean Temperature Driver of Year-to-Year Weather
- Beyond ENSO: Other Ocean Temperature Patterns That Affect Weather
- Sea Surface Temperature and Hurricane Development
- Ocean Heat Content vs Sea Surface Temperature: Why the Distinction Matters
- Related Topics in the ENSO and Weather Science Cluster
- Frequently Asked Questions
The short answer: Ocean temperatures affect weather through three main pathways: evaporation, heat transfer, and large-scale circulation patterns. Warmer water evaporates more moisture, fuelling rainfall and storms. Oceans transfer heat to the overlying atmosphere, modifying surface temperatures across coastal and downwind regions. And large-scale sea surface temperature patterns like ENSO, the AMO, and the PDO drive atmospheric circulation changes that shape weather across entire continents for months at a time.
- Oceans cover 71% of Earth's surface and absorb roughly 90% of the excess heat from global warming
- Warmer sea surface temperatures increase evaporation, fuelling heavier rainfall and stronger storms
- Around 26°C (79°F) is the traditional operational guideline for hurricane development: atmospheric conditions also play an important role
- ENSO is the most significant short-term (interannual) ocean temperature pattern affecting global weather
- The Atlantic Multidecadal Oscillation and Pacific Decadal Oscillation operate on much longer timescales
- Ocean heat content, not just surface temperature, is increasingly important for understanding hurricane intensification
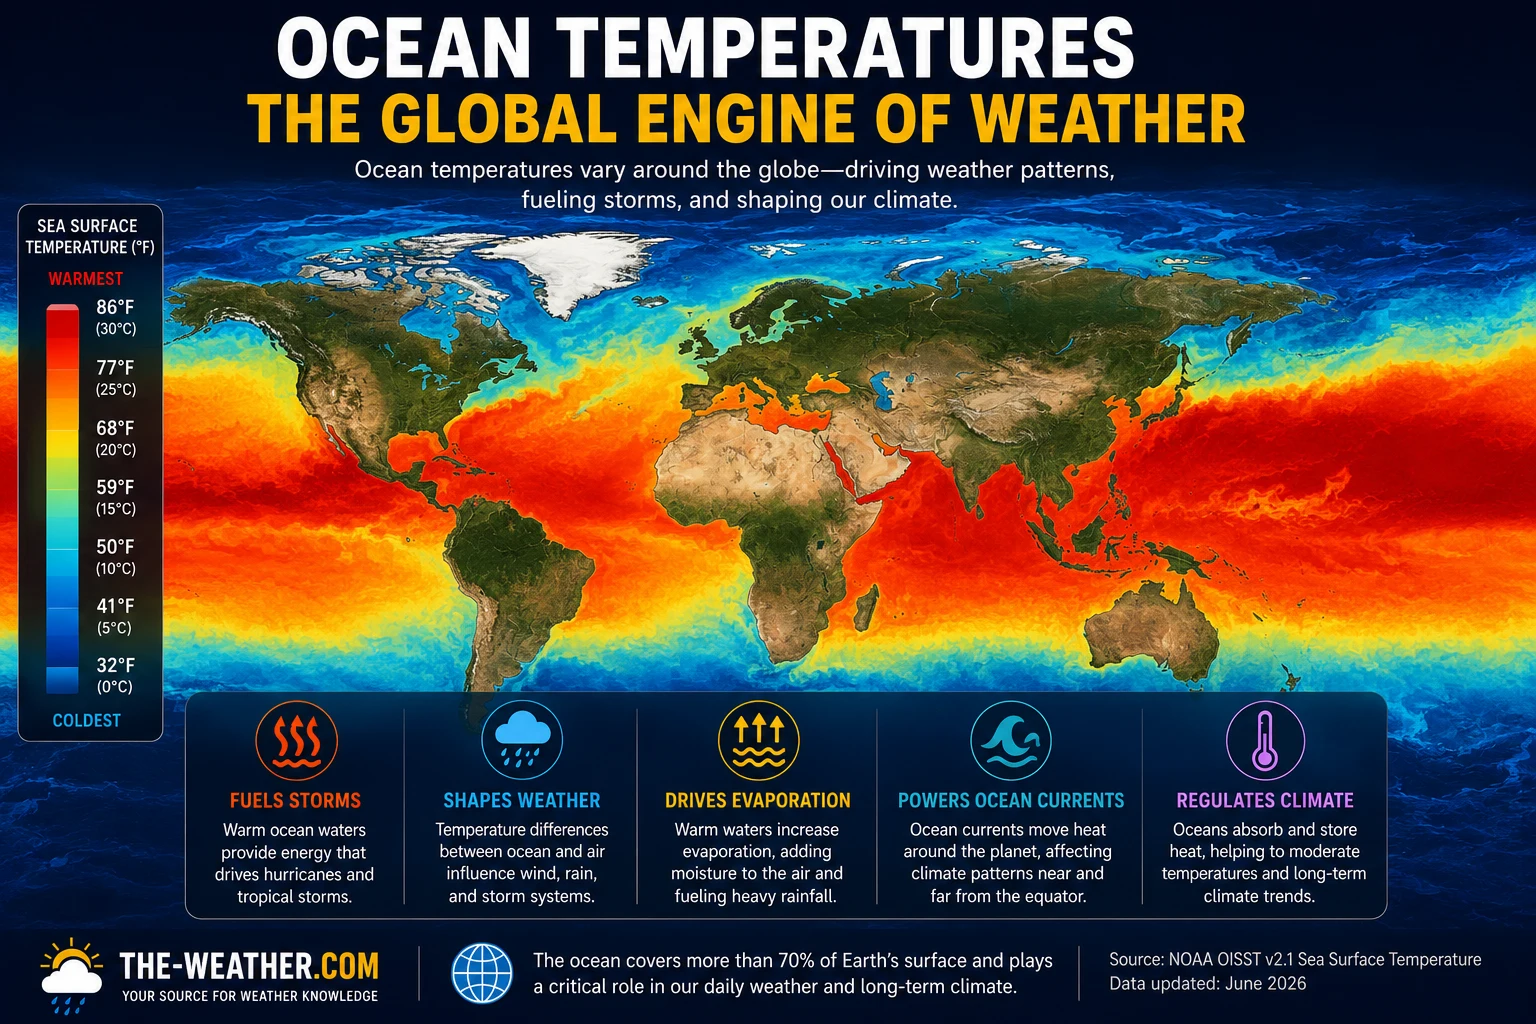
Global sea surface temperature maps reveal the full scale of ocean temperature variability, from the warm tropical waters that fuel hurricanes to the cool upwelling zones that sustain fisheries.
This page covers the three pathways from ocean temperature to weather, the key oscillation patterns that matter for seasonal forecasting, the specific role of sea surface temperature in hurricane development, and how ocean heat content differs from surface temperature. It connects directly to El Niño and La Niña effects and Understanding ENSO.
The Three Pathways From Ocean Temperature to Weather
The infographic below illustrates how ocean temperatures translate into weather through three distinct mechanisms: each operating on different spatial scales and timescales.
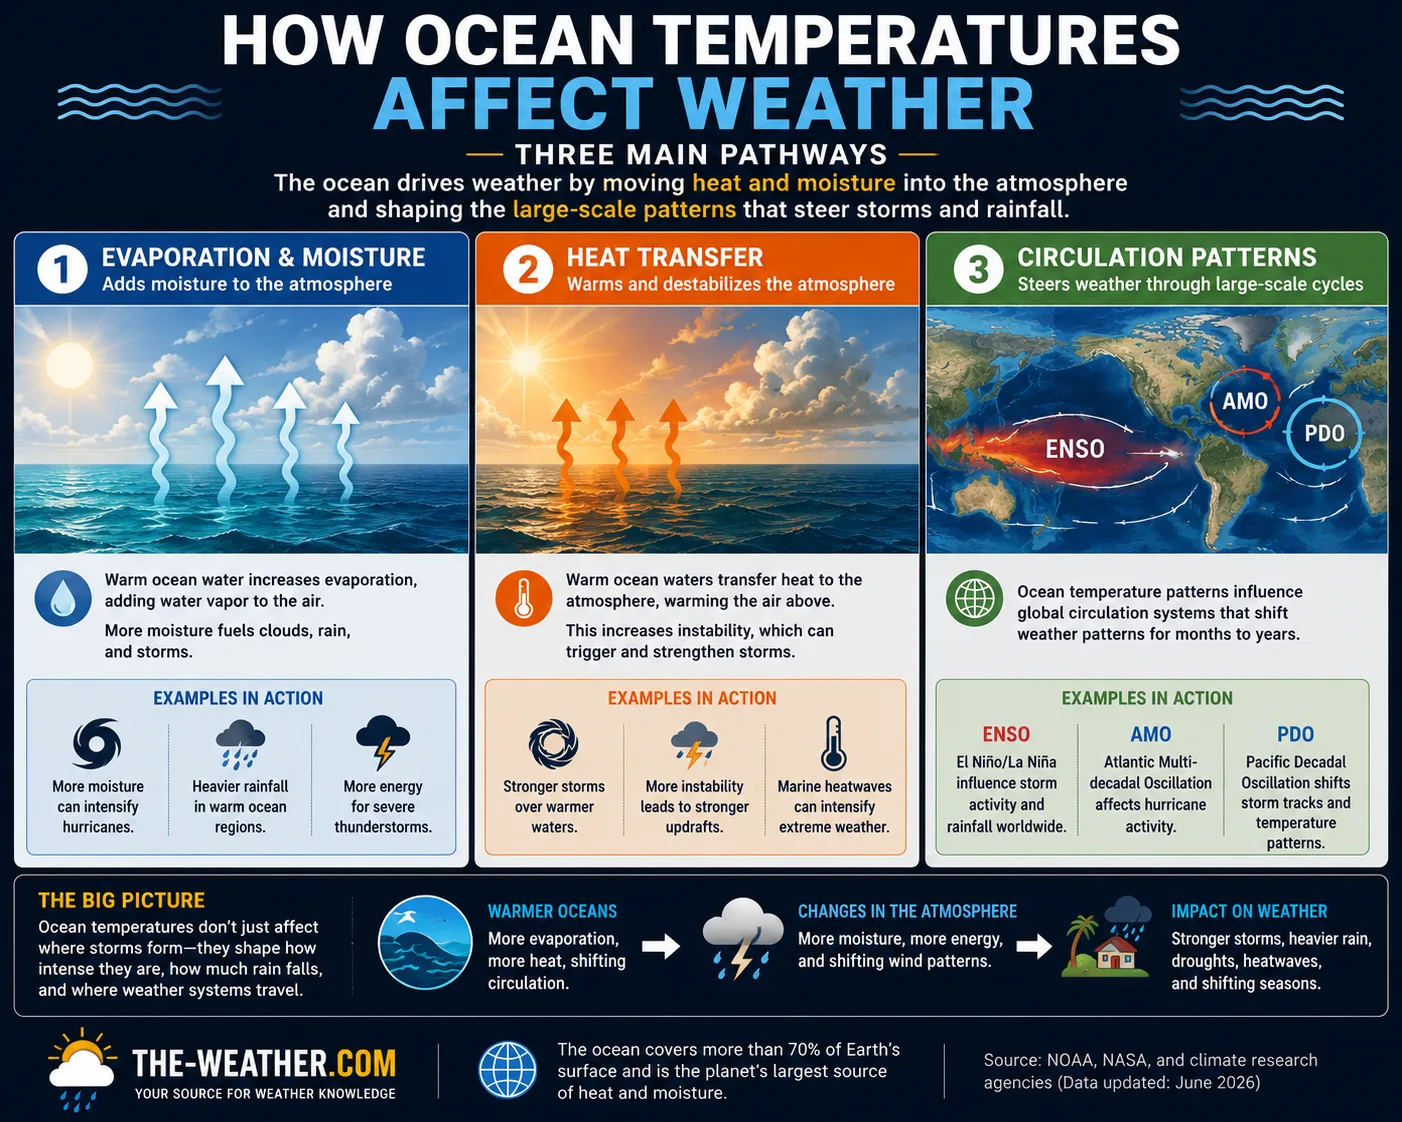
The three pathways from ocean temperature to weather: operating across different scales from local coastal effects to global circulation patterns.
Warmer water evaporates more readily, loading the atmosphere with moisture that fuels precipitation. The relationship is exponential: a 1°C rise in SST increases evaporation by roughly 6-7%, directly increasing the amount of moisture available for rainfall and storms.
The ocean transfers sensible heat directly to the overlying air through conduction and turbulent exchange. Coastal regions and areas downwind of warm currents experience noticeably warmer air temperatures than their latitude alone would suggest: the Gulf Stream keeping northwest Europe milder than equivalent latitudes in Canada is a classic example.
Large-scale patterns of anomalously warm or cool sea surface temperatures alter where air rises and sinks, shifting jet streams, storm tracks, and precipitation patterns across entire continents. This pathway, most dramatically expressed through ENSO, operates on timescales of months to decades.
Sea Surface Temperature: What It Is and How It Is Measured
Sea surface temperature (SST) refers to the temperature of the ocean at or very near the surface, typically the top one metre of water. It is distinct from ocean heat content, which measures stored thermal energy through the full water column to depths of 300 metres or more.
| SST measurement method | What it captures | Primary use |
|---|---|---|
| NOAA buoy network | In-situ surface and subsurface temperature at fixed locations | Real-time ENSO monitoring · ocean heat content |
| Argo float network | Temperature and salinity profiles to 2,000m depth at 3,000+ locations | Ocean heat content · subsurface El Niño signals |
| Satellite infrared | Skin temperature of the surface: top millimetre | Global SST mapping · hurricane track forecasting |
| Ship-based measurements | Engine intake water temperature: bulk SST at ~5m depth | Historical record back to 1850s · climate trend analysis |
| ERSSTv5 blended product | Combined satellite, buoy, and ship data into a gridded dataset | NOAA ONI calculation · official ENSO classification |
NOAA publishes weekly SST anomaly maps that show departures from the long-term average for every ocean basin. These maps are the primary tool forecasters use to identify developing ENSO conditions, monitor the progress of existing events, and assess the background state for seasonal hurricane outlooks.
ENSO: The Primary Ocean Temperature Driver of Year-to-Year Weather
Of all the ocean temperature patterns that affect weather, ENSO is by far the most significant on the timescales that matter for seasonal forecasting. The El Niño/Southern Oscillation cycle, driven by sea surface temperature anomalies in the tropical Pacific, influences temperature, rainfall, and storm patterns across every continent simultaneously, with effects that can be predicted months in advance.
The mechanism is straightforward: when the central and eastern tropical Pacific warms above its long-term average (El Niño), the entire tropical atmospheric circulation reorganises. The Walker Circulation weakens, rainfall shifts from the western to the central Pacific, jet streams reposition across North America and Asia, and wind shear over the Atlantic increases: suppressing hurricane development while enhancing it in the Pacific.
When the same region cools below average (La Niña), the opposite occurs: the Walker Circulation intensifies, rainfall returns to the western Pacific and Australia, and Atlantic wind shear decreases, producing more active hurricane seasons.
Beyond ENSO: Other Ocean Temperature Patterns That Affect Weather
ENSO operates on a 3 to 7 year cycle. Several other ocean temperature patterns operate on much longer timescales, decades rather than years, and interact with ENSO to modulate its effects.
A pattern widely described as alternating warmer and cooler sea surface temperatures across the North Atlantic over periods of 20 to 40 years. During warm AMO phases, Atlantic hurricane activity tends to be higher; during cool phases, lower. The AMO is also associated with US and European summer temperatures and Sahel rainfall. Its physical mechanism remains actively debated: some researchers attribute it primarily to natural ocean circulation variability, others to external forcing including aerosols and greenhouse gases.
A long-cycle pattern of SST variability in the North Pacific with warm and cool phases lasting decades. During warm PDO phases, El Niño effects tend to be amplified; during cool phases, La Niña effects are amplified. The PDO interacts with ENSO rather than operating independently: it modulates ENSO's influence on North American climate rather than driving large-scale global weather shifts on its own.
A pattern of anomalous SSTs across the Indian Ocean with positive (warm west, cool east) and negative (cool west, warm east) phases. A positive IOD event is associated with drought in Australia and Indonesia and flooding in East Africa. It often co-occurs with El Niño. The IOD is increasingly recognised as an important independent predictor of seasonal weather in the Indian Ocean region.
Major ocean current systems like the Gulf Stream carry enormous amounts of heat poleward, moderating the climate of coastal regions. Northwest Europe benefits from a combination of the Gulf Stream's poleward heat transport, prevailing westerly winds, and large-scale atmospheric circulation: together producing milder conditions than equivalent latitudes elsewhere. Changes in current strength or position, whether seasonal or longer-term, directly affect coastal weather patterns, fog frequency, and precipitation in downwind regions.
Sea Surface Temperature and Hurricane Development
Tropical cyclones are thermal engines: they convert the heat stored in warm ocean water into kinetic energy. Around 26°C (79°F) is the traditional operational guideline for tropical cyclone development throughout the upper 50 metres of the ocean, though modern research shows other atmospheric conditions also play an important role, and hurricanes can occasionally develop or persist at slightly lower temperatures under particularly favourable circumstances.
But surface temperature alone does not tell the full story. A hurricane that passes over a shallow layer of warm water can quickly exhaust its fuel supply as it mixes cooler subsurface water to the surface: a process called upwelling-induced cooling or cold wake formation. A hurricane over deep warm water maintains its fuel supply far more effectively.
This is why ocean heat content, the total thermal energy stored from the surface down through the warm layer, has become increasingly important to hurricane intensity forecasters. The Tropical Cyclone Heat Potential (TCHP), calculated by NOAA from Argo float and satellite data, maps the depth of warm water available to sustain and intensify storms. Areas with high TCHP are considered prime rapid intensification zones.
Ocean Heat Content vs Sea Surface Temperature: Why the Distinction Matters
Sea surface temperature measures the ocean at the very top. Ocean heat content measures how much thermal energy is stored through the entire warm layer, typically the top 300 to 700 metres. The two are related but not interchangeable, and for understanding weather they serve different purposes.
- SST is most relevant for: immediate evaporation and moisture loading, hurricane surface energy supply, ENSO phase diagnosis, short-range precipitation forecasting
- Ocean heat content is most relevant for: hurricane rapid intensification potential, long-term ENSO evolution forecasting, subsurface El Niño signal detection, climate trend analysis
The distinction between SST and ocean heat content has become more practically important in recent decades as the ocean has absorbed roughly 90% of the excess heat from global warming. Much of this heat is stored below the surface: invisible in SST maps but detectable in Argo float profiles and ocean heat content anomaly maps. The subsurface warming is what makes the baseline for hurricane intensification in the current era different from 30 or 40 years ago.
Related Topics in the ENSO and Weather Science Cluster
Frequently Asked Questions
How do ocean temperatures affect weather?
Ocean temperatures affect weather through three main pathways. Warmer water evaporates more moisture, fuelling precipitation and storms. Oceans transfer heat to the overlying air, modifying surface temperatures in coastal regions. And large-scale SST patterns like ENSO drive atmospheric circulation changes that alter weather across entire continents: the most significant example being the ENSO cycle in the tropical Pacific.
What is sea surface temperature?
Sea surface temperature (SST) is the temperature of the ocean at or very near the surface, typically the top one metre of water. NOAA monitors SST globally using buoys, ships, and satellites. SST anomalies, departures from the long-term average, are the key metric used to identify patterns like El Niño, La Niña, and the Atlantic Multidecadal Oscillation.
What is the Atlantic Multidecadal Oscillation?
The AMO is a long-cycle pattern of warmer and cooler sea surface temperatures across the North Atlantic, varying over periods of 20 to 40 years. During warm AMO phases, Atlantic hurricane activity tends to be higher than average. During cool phases, it tends to be lower. The AMO operates on much longer timescales than ENSO and through different mechanisms.
Why do warm oceans produce more hurricanes?
Tropical cyclones derive their energy from the evaporation of warm seawater. Around 26°C (79°F) is the traditional operational threshold for hurricane development in the upper 50 metres, though favourable atmospheric conditions can allow development at slightly lower temperatures in some cases. Warmer water provides more evaporative energy, allows faster intensification, and sustains storms longer. Ocean heat content, the depth of warm water available, is increasingly important for understanding rapid intensification potential.
The complete ENSO overview connecting ocean temperature patterns to global weather impacts.
Sources
- NOAA Climate.gov: Sea surface temperature anomaly data and explainers
- NOAA AOML: Tropical Cyclone Heat Potential methodology
- NOAA PSL: ENSO indices and Pacific Decadal Oscillation
- WMO: Ocean temperature and ENSO reference
No manufacturer compensation received. Science sourced from NOAA, WMO, and peer-reviewed oceanographic and atmospheric literature.

Lena Thornton
Weather Station Analyst & CWOP Contributor. Lena researches ocean-atmosphere interactions and ENSO science using official NOAA and WMO sources. Published July 2026.