As an Amazon Associate, I earn from qualifying purchases.
In this article 16 sections
- What Is Barometric Pressure?
- How Is Barometric Pressure Measured?
- What the Numbers Mean
- High Pressure vs Low Pressure
- How Barometric Pressure Affects Weather
- How Barometric Pressure Affects the Body
- How to Read a Barometer
- Barometric Pressure and Fishing
- Monitoring Barometric Pressure at Home
- Pressure Trend: What a Falling Barometer Looks Like
- Why Is My Barometer Reading Different?
- Common Barometric Pressure Myths
- Barometric Pressure and Outdoor Activities
- Barometric Pressure in Aviation
- Barometric Pressure by Season
- Frequently Asked Questions

An aneroid barometer measures atmospheric pressure mechanically with no liquid. The needle moves as pressure rises or falls.
Among all weather measurements available to home observers, barometric pressure is one of the strongest predictors of changing weather conditions. Unlike temperature, which tells you what conditions are right now, pressure tells you where conditions are heading. A falling barometer is one of the oldest and most reliable signs that bad weather is on the way. A rising barometer after a storm tells you the worst has passed.
What Is Barometric Pressure?
A short explainer on what barometric pressure is and how it drives weather patterns.
Barometric pressure is the force exerted by the weight of the atmosphere above a specific point. The atmosphere has mass: the column of air above every square inch of the earth's surface weighs approximately 14.7 pounds at sea level. A barometer measures this weight as pressure.
The name comes from the Greek baros (weight) and metron (measure). Evangelista Torricelli invented the mercury barometer in 1643 and demonstrated that atmospheric pressure supports a column of mercury roughly 30 inches tall, which is why pressure is still commonly measured in inches of mercury (inHg) today, even in digital instruments that contain no liquid mercury.
Pressure changes constantly as weather systems move across the surface. High pressure systems are columns of descending, dense air. Low pressure systems are columns of rising, less dense air. The difference in pressure between systems drives wind and determines what kind of weather a location experiences.
How Is Barometric Pressure Measured?
Barometric pressure is measured with a barometer. Three main types are in common use:
| Type | How it works | Common use |
|---|---|---|
| Mercury barometer | Atmospheric pressure supports a column of liquid mercury in a sealed tube. The height of the column in inches gives the pressure reading. | Scientific reference standard |
| Aneroid barometer | A sealed metal capsule expands or contracts with pressure changes, moving a mechanical needle across a dial. | Home barometers, wall-mounted instruments |
| Digital barometer | A piezoelectric or capacitive sensor detects pressure changes electronically and displays them digitally. | Home weather stations, smartphones |
Units of measurement
Barometric pressure is expressed in several units depending on the context:
- Inches of mercury (inHg): The standard unit in the United States for consumer weather instruments. Normal sea-level pressure is 29.92 inHg.
- Hectopascals (hPa): The international meteorological standard. Normal sea-level pressure is 1013.25 hPa. Also written as millibars (mb): 1 hPa equals 1 mb.
- Kilopascals (kPa): Used in some scientific and engineering contexts. 101.325 kPa equals standard sea-level pressure.
Need to switch units? Our free barometric pressure converter shows one reading in seven units at once, and our weather tools page lists the rest.
Modern smartphones include a barometric pressure sensor: primarily used to assist GPS altitude calculations. The readings are accurate enough to detect floor-level changes in a building, but the sensor is not accessible for general weather monitoring in most phone interfaces.
What the Numbers Mean

Barometric pressure scale showing what each range means for weather conditions.
| Pressure (inHg) | Pressure (hPa) | Classification | Weather indication |
|---|---|---|---|
| Below 29.60 | Below 1002 | Very Low | Storms, heavy rain, strong winds likely |
| 29.60–29.80 | 1002–1009 | Low | Unsettled, rain possible, clouds likely |
| 29.80–30.20 | 1009–1023 | Normal | Variable, depends on trend direction |
| 30.20–30.40 | 1023–1029 | High | Fair weather, clearing conditions |
| Above 30.40 | Above 1029 | Very High | Dry, settled, clear skies |
High Pressure vs Low Pressure
- Air descends and warms
- Skies clear, clouds dissipate
- Winds are light
- Fair, dry, settled weather
- Fog possible in winter mornings
- Reading above 30.20 inHg
- Air rises and cools
- Clouds form, precipitation likely
- Winds increase toward centre
- Unsettled, stormy conditions
- Severe weather at very low pressures
- Reading below 29.80 inHg
How Barometric Pressure Affects Weather
Pressure drives weather by creating differences in air density that cause air to move horizontally (wind) and vertically (updrafts and downdrafts). The atmosphere is constantly trying to equalise these pressure differences, and the movement it creates is what we experience as weather.
The pressure trend is more important than the reading
A reading of 29.80 inHg tells you little on its own. The same reading reached by falling pressure from 30.20 signals approaching bad weather. The same reading reached by rising pressure from 29.40 signals improving conditions. Meteorologists watch the rate of pressure change rather than the absolute value.
The NWS considers a pressure drop of 0.06 inHg or more per hour to be a significant change that warrants attention. A drop of 0.10 inHg or more in three hours is a reliable short-term indicator of approaching rain or storms.
Pressure and wind
Wind flows from high pressure to low pressure areas, and the greater the difference between them, the stronger the wind. In the northern hemisphere, winds circulate clockwise around high pressure systems and anticlockwise around low pressure systems: a consequence of the Coriolis effect from the earth's rotation.
Pressure and precipitation
Low pressure systems cause air to rise. As it rises, it cools, and water vapour condenses to form clouds and precipitation. This is why falling pressure reliably precedes rain. High pressure pushes air downward, warming it and preventing cloud formation, which is why high pressure typically brings clear skies.
How Barometric Pressure Affects the Body
Rapid changes in barometric pressure affect some people significantly. The most commonly reported effects are:
Headaches and migraines
Research published in the journal Cephalalgia found that migraine attacks are more frequent when atmospheric pressure drops. The proposed mechanism involves changes in the pressure difference between the sinuses and the surrounding atmosphere: lower external pressure allows sinus tissue to expand slightly, pressing on nerves. Studies suggest headaches are most common when pressure drops below 29.50 inHg (999 hPa) or changes rapidly by more than 0.20 inHg.
Joint pain
People with arthritis and other joint conditions commonly report increased pain before storms. The theory is that falling pressure allows tissues around joints to expand slightly, increasing pressure on the joint. While the effect is modest, typically a few millimetres of mercury, it is enough for sensitive individuals to notice.
Most comfortable pressure range
Most people feel comfortable at pressures between 29.80 and 30.20 inHg (1008 to 1023 hPa). Gradual pressure changes are generally not noticeable. It is rapid changes, particularly rapid drops, that cause the most discomfort. Stable pressure at almost any value in the normal range is comfortable for most people.
How to Read a Barometer
Reading a barometer correctly requires understanding both the current value and the trend: how the pressure has changed over the past few hours.
| Pressure trend | Rate of change | Forecast indication |
|---|---|---|
| Rapidly rising | 0.06+ inHg per hour | Clearing quickly, winds may be gusty initially |
| Slowly rising | 0.02–0.05 inHg per hour | Gradual improvement, fair weather developing |
| Steady | Less than 0.02 inHg per hour | Conditions likely to continue unchanged |
| Slowly falling | 0.02–0.05 inHg per hour | Gradual deterioration, cloud and rain possible |
| Rapidly falling | 0.06+ inHg per hour | Storm approaching, conditions deteriorating quickly |
Setting the barometer
Analog aneroid barometers have a setting hand that you manually move to the current reading. Over the following hours, you compare where the needle has moved relative to where you set the hand, if the needle has dropped below the setting hand, pressure has fallen. If it has risen above, pressure has risen.
Digital barometers in home weather stations display trend arrows automatically and plot 24-hour pressure graphs in their apps, removing the need to manually track the reading.
Barometric Pressure and Fishing
Anglers have long tracked barometric pressure because fish behaviour changes with atmospheric pressure. The basic pattern that most experienced anglers observe:
- Rising pressure: Fish become more active and move to shallower water. Often the best conditions for surface fishing and lure fishing.
- Stable high pressure: Fish are active but may be deeper. Consistent results with patience.
- Rapidly falling pressure: Can trigger intense feeding frenzies as fish sense the approaching system and feed aggressively before the storm.
- Low stable pressure: Fish activity decreases. Many species move deeper and become less responsive to lures.
- Rising after a storm: As pressure recovers and stabilises, fish activity gradually returns. Best fishing is often 12 to 24 hours after a front passes.
The ideal barometric pressure range for most freshwater fishing is between 29.70 and 30.40 inHg with stable or slowly rising conditions. Pressure trends matter more than absolute values.
Monitoring Barometric Pressure at Home
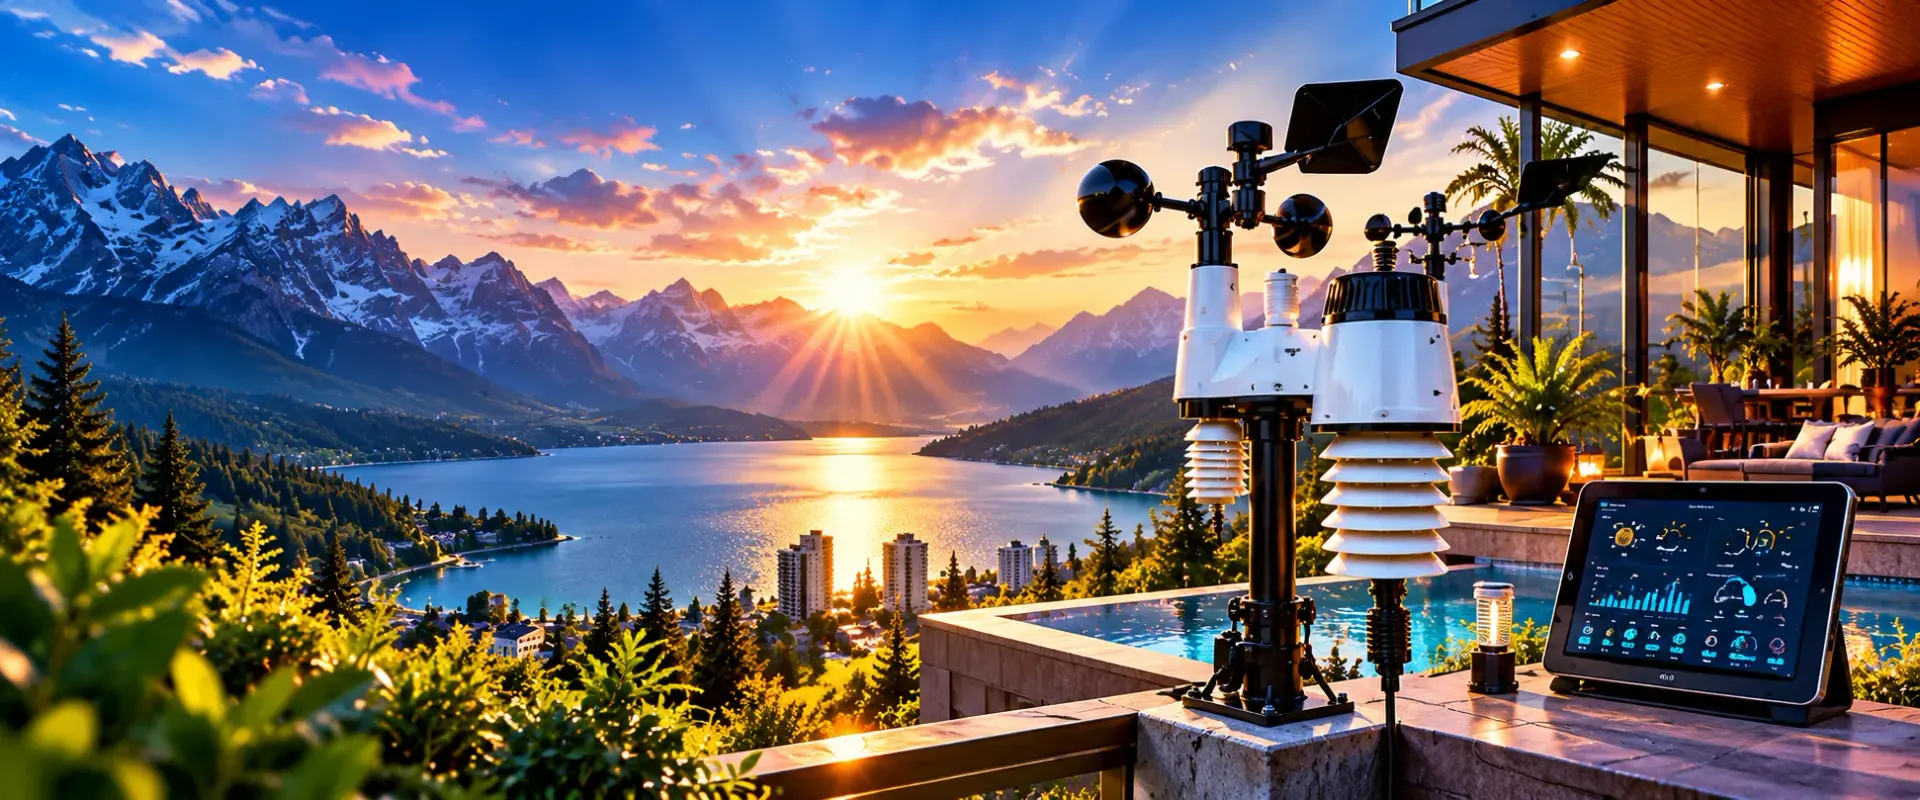
All home weather stations include a digital barometer. The better ones display 24-hour pressure graphs that make trend monitoring straightforward.
For a standalone barometer see our best home barometers guide. For a complete weather station that also measures wind, rain, temperature and humidity alongside pressure, see our home weather stations comparison.
Want pressure together with wind, rain and temperature? Our guide to the 5 best home weather stations compares full stations that show barometric pressure as well.
Pressure Trend: What a Falling Barometer Looks Like
The trend over the last 3 to 6 hours tells you more than any single reading. Here is what a classic storm approach looks like on a barometer:
Why Is My Barometer Reading Different?
If your barometer reads 29.40 inHg on a perfectly clear day, it is almost certainly not broken: you are probably at elevation. Atmospheric pressure decreases with altitude because there is less air above you. This is the most common reason home barometers read differently from the forecast.
The altitude effect
Pressure drops by approximately 1 inHg per 1,000 feet of elevation (or about 1 hPa per 8 metres). A home at 2,000 feet above sea level will have a baseline pressure around 27.90 inHg on a normal day, not 29.92 inHg. This is normal and expected.
Sea-level adjustment
To make pressure readings comparable between locations at different altitudes, meteorologists always report pressure adjusted to sea-level equivalent. This is called mean sea level pressure (MSLP). Your home weather station should be set to your elevation so it can calculate and display MSLP automatically.
How to calibrate your barometer
In your weather station app or console, enter your elevation above sea level in feet or metres. The device adds a correction factor to convert your actual measured pressure to MSLP. Once calibrated, your readings will match the forecast and neighbouring weather stations at any elevation.
Common Barometric Pressure Myths
Reality: Pressure falls first, then rain follows. Falling pressure indicates a low pressure system is approaching, which will eventually bring rain. The pressure drop is the early warning; the rain arrives hours later. This is what makes a barometer useful as a forecasting tool rather than just a current-conditions instrument.
Reality: High pressure usually brings clear skies, but in winter it can also bring fog, frost and temperature inversions. When high pressure traps cold air near the surface, you get grey, murky days with no wind, not the sunshine people associate with high pressure.
Reality: A steady barometer means the current pressure system is not changing: it does not mean the weather will not change. A slow-moving front can bring significant weather change while pressure remains relatively stable for hours beforehand.
Reality: 29.92 inHg is the standard sea-level pressure, not a fixed reading every barometer should show. Pressure varies constantly with weather systems, and your reading will be lower at elevation. A reading of 29.40 on a clear day at 500 feet elevation is perfectly normal.
Barometric Pressure and Outdoor Activities
| Pressure | Typical Weather | Hiking | Fishing | Flying | Gardening |
|---|---|---|---|---|---|
| Very High (30.40+) | Dry, clear, settled | Excellent | Fair (fish deep) | Excellent | Excellent |
| High (30.20–30.40) | Fair, sunny | Excellent | Good | Excellent | Excellent |
| Normal (29.80–30.20) | Variable | Good | Good | Good | Good |
| Low (29.60–29.80) | Unsettled, rain possible | Fair | Active feeding | Check forecast | Fair |
| Very Low (below 29.60) | Storms likely | Poor | Poor | Avoid | Poor |
Barometric Pressure in Aviation
Barometric pressure is critical in aviation because aircraft altimeters measure altitude using atmospheric pressure rather than GPS. An altimeter works by measuring how much pressure has dropped from sea level: the less pressure, the higher the altitude. Pilots must set the current local barometric pressure (the QNH setting) into their altimeter before takeoff so it reads the correct altitude above sea level rather than above the standard pressure datum.
Airports broadcast the current altimeter setting in Automatic Terminal Information Service (ATIS) recordings updated hourly. A failure to update the altimeter setting when pressure has changed can cause the aircraft to fly at a different altitude than the pilot believes: a significant safety concern in instrument conditions or when near terrain. This is why pressure measurement has been a core part of aviation since the earliest powered flight.
Barometric Pressure by Season
Winter brings the largest and fastest pressure swings of the year. Deep low pressure systems tracking across the continent can drop pressure by 1 inHg or more in a few hours during intense winter storms. High pressure behind cold fronts can push readings above 30.50 inHg. The contrast between warm and cold air masses drives these extreme swings.
Summer pressure is generally more stable with smaller overall swings. A regular pattern in many inland areas is a slight afternoon pressure dip as surface heating creates localised low pressure that can trigger afternoon thunderstorms. Coastal areas see a daily sea breeze cycle tied to land and sea temperature differences.
Hurricanes produce the lowest barometric pressure readings ever observed at the surface. The record low for a US landfall hurricane was 26.35 inHg during Hurricane Gilbert in 1988. Even a Category 1 hurricane will push pressure below 28.94 inHg. A rapid pressure drop of more than 1 inHg in 24 hours near a tropical system is a warning of rapid intensification.
Transitional seasons bring active weather with frequent frontal passages and moderate pressure swings. Spring in particular produces rapid pressure changes as cold polar air and warm Gulf air clash across the central US, creating the conditions for severe thunderstorm and tornado outbreaks. Monitoring pressure trends is most valuable during these seasons.
Frequently Asked Questions
What is barometric pressure in simple words?
Barometric pressure is the weight of the air above you pressing down on the earth's surface. Normal sea-level pressure is 29.92 inHg. Falling pressure means deteriorating weather is approaching. Rising pressure means conditions are improving.
Is 29.8 barometric pressure high or low?
29.8 inHg is slightly below normal sea-level pressure of 29.92 inHg, in the low-normal range. If pressure is falling toward 29.8, deteriorating conditions are likely. If it is rising toward 29.8 from below, conditions may be improving. The trend matters more than the absolute value.
Is higher or lower barometric pressure better?
High barometric pressure (above 30.20 inHg) is associated with fair, dry and settled weather. Low pressure (below 29.60 inHg) is associated with storms and rain. For most outdoor activities, higher pressure is better. For fishing, falling or low pressure can trigger active feeding periods.
How does barometric pressure affect a person?
Falling barometric pressure can cause headaches, joint pain and fatigue in some people. The effect is most noticeable during rapid drops. People with migraines, arthritis or sinus conditions often report increased symptoms when pressure drops quickly. The most comfortable range for most people is 29.80 to 30.20 inHg.
Does rain lower or raise barometric pressure?
Rain follows falling pressure rather than causing it. Low pressure systems draw in moist air that rises, cools and condenses to form rain. Falling pressure precedes rain. A rapid drop of 0.10 inHg or more in three hours is a reliable indicator of approaching rain or storms.
What is the most comfortable barometric pressure for humans?
Most people feel comfortable at pressures between 29.80 and 30.20 inHg (1008 to 1023 hPa). Gradual changes are generally not noticeable. Rapid drops, particularly 0.10 inHg or more in three hours, cause the most discomfort in pressure-sensitive individuals.
What level of barometric pressure causes headaches?
Research suggests headaches are more common when pressure drops below 29.50 inHg (999 hPa) or when pressure changes rapidly by more than 0.20 inHg in a short period. Individual sensitivity varies widely.
What barometric pressure is good for fishing?
Most anglers find the best fishing between 29.70 and 30.40 inHg with stable or slowly rising conditions. Rapidly falling pressure can trigger feeding frenzies before a storm. Extended low pressure reduces fish activity. The trend matters more than the absolute reading.
Sources
Pressure standards from NOAA National Weather Service and World Meteorological Organisation Guide to Meteorological Instruments and Methods of Observation (WMO-No.8). Headache research referenced from Cephalalgia journal. Beaufort pressure thresholds from the UK Met Office. No manufacturer compensation was received.

Lena Thornton
Weather Station Analyst & CWOP Contributor. Lena has researched, reviewed and analysed weather stations and atmospheric instruments for over a decade. She contributes observation data to the Citizen Weather Observer Program (CWOP) and writes exclusively for the-weather.com.