
As an Amazon Associate, I earn from qualifying purchases.
In this article 7 sections
The short answer: According to NOAA's Oceanic Niño Index (ONI), the 2015-16 El Niño reached the highest recorded peak of +2.6°C, though some alternative sea surface temperature datasets rank 1997-98 similarly. The 1997-98 event is the strongest of the 20th century at +2.3°C and produced the most documented global damage. The developing 2026-27 event is already in strong territory and some ensemble models project it could challenge or exceed both, but forecast uncertainty at this stage is high.
- According to NOAA's ONI dataset, the 2015-16 event reached a peak of +2.6°C: the highest value in the modern ONI record, though rankings vary by dataset
- The 1997-98 event was the most damaging of the 20th century: an estimated 23,000 deaths attributed to the event and ~$35 billion in damage per NOAA NCEI
- Super El Niño is informal: NOAA's official top category is "very strong" (ONI above +1.5°C)
- Five events have exceeded +2.0°C since 1950: 1972-73, 1982-83, 1997-98, 2015-16, and 2023-24
- The 2026-27 event is developing rapidly: current models project a strong to potentially historic peak

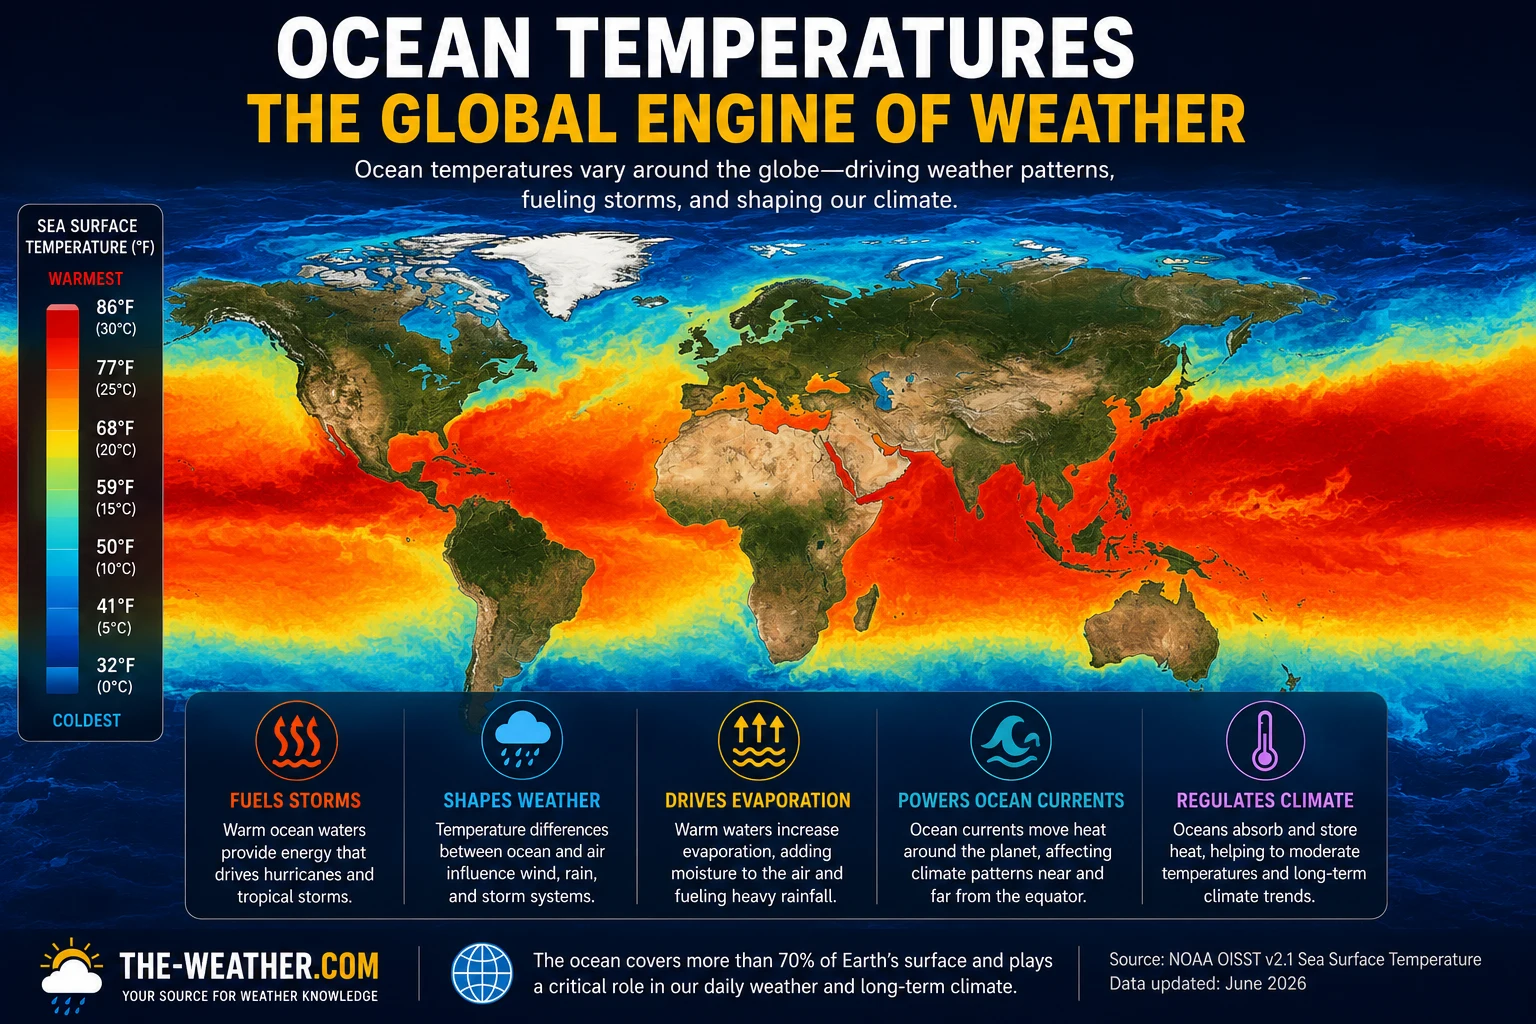
Sea surface temperature anomaly maps during peak El Niño conditions show the warm water plume extending across the equatorial Pacific: the visual signature of a strong event.
This page covers every major El Niño event in the modern record, ranked by peak Niño 3.4 anomaly, with detailed impact summaries for the strongest events. For a live update on the developing 2026-27 event see our Super El Niño 2026 tracker.
2026 El Niño update: NOAA's update of October 8, 2026: a strong-to-very strong El Niño is likely through January to March 2027 (a greater than 83% chance). What that could mean where you live: how strong could the 2026 El Niño become, with regional pages for California, Colorado and the Rockies and the Midwest.
Event Strength Comparison: Peak ONI Values

Super El Niño events ranked by peak ONI value: the 2015-16 event currently holds the record at +2.6°C.
The bar chart below shows every El Niño event commonly classified as a super El Niño since 1950, ranked by peak ONI value. The threshold for informal "super" classification is +2.0°C. All values are from NOAA CPC official historical records.
⚡ 2026-27 value is ECMWF/NOAA ensemble forecast median as of July 2026, not yet an observed value. Striped bar indicates forecast. Sources: NOAA CPC, MRCC/Purdue.
Complete El Niño Event Record: All Events Since 1950
The table below covers all El Niño events classified as moderate or stronger since 1950. Peak ONI values from NOAA CPC official historical records.
| Event | Duration | Peak ONI | Strength | Key global impact |
|---|---|---|---|---|
| 2015-16 RECORD | Mar 2015–May 2016 | +2.6°C | Very Strong | Global temp record set 2016 · California flooding · Indonesia drought and fires · South Africa famine risk |
| 1997-98 | May 1997–May 1998 | +2.3°C | Very Strong | An estimated 23,000 deaths attributed to the event · ~$35B damage · California mudslides · Indonesia fires · coral bleaching |
| 2023-24 | Jun 2023–May 2024 | +2.1°C | Very Strong | Global temperature records · drought in parts of Amazon · Pacific hurricane activity |
| 1982-83 | Apr 1982–Jun 1983 | +2.2°C | Very Strong | Largely unpredicted · drought in Australia · flooding in Peru · $4–8B damage · catalysed ENSO research |
| 1972-73 | May 1972–Mar 1973 | +1.8°C | Strong | Peruvian anchovy fishery collapse · drought in India and Africa · USSR grain shortfall |
| 2009-10 | Jul 2009–Apr 2010 | +1.6°C | Strong | Heat extremes in parts of Australia · drier than normal US Southwest |
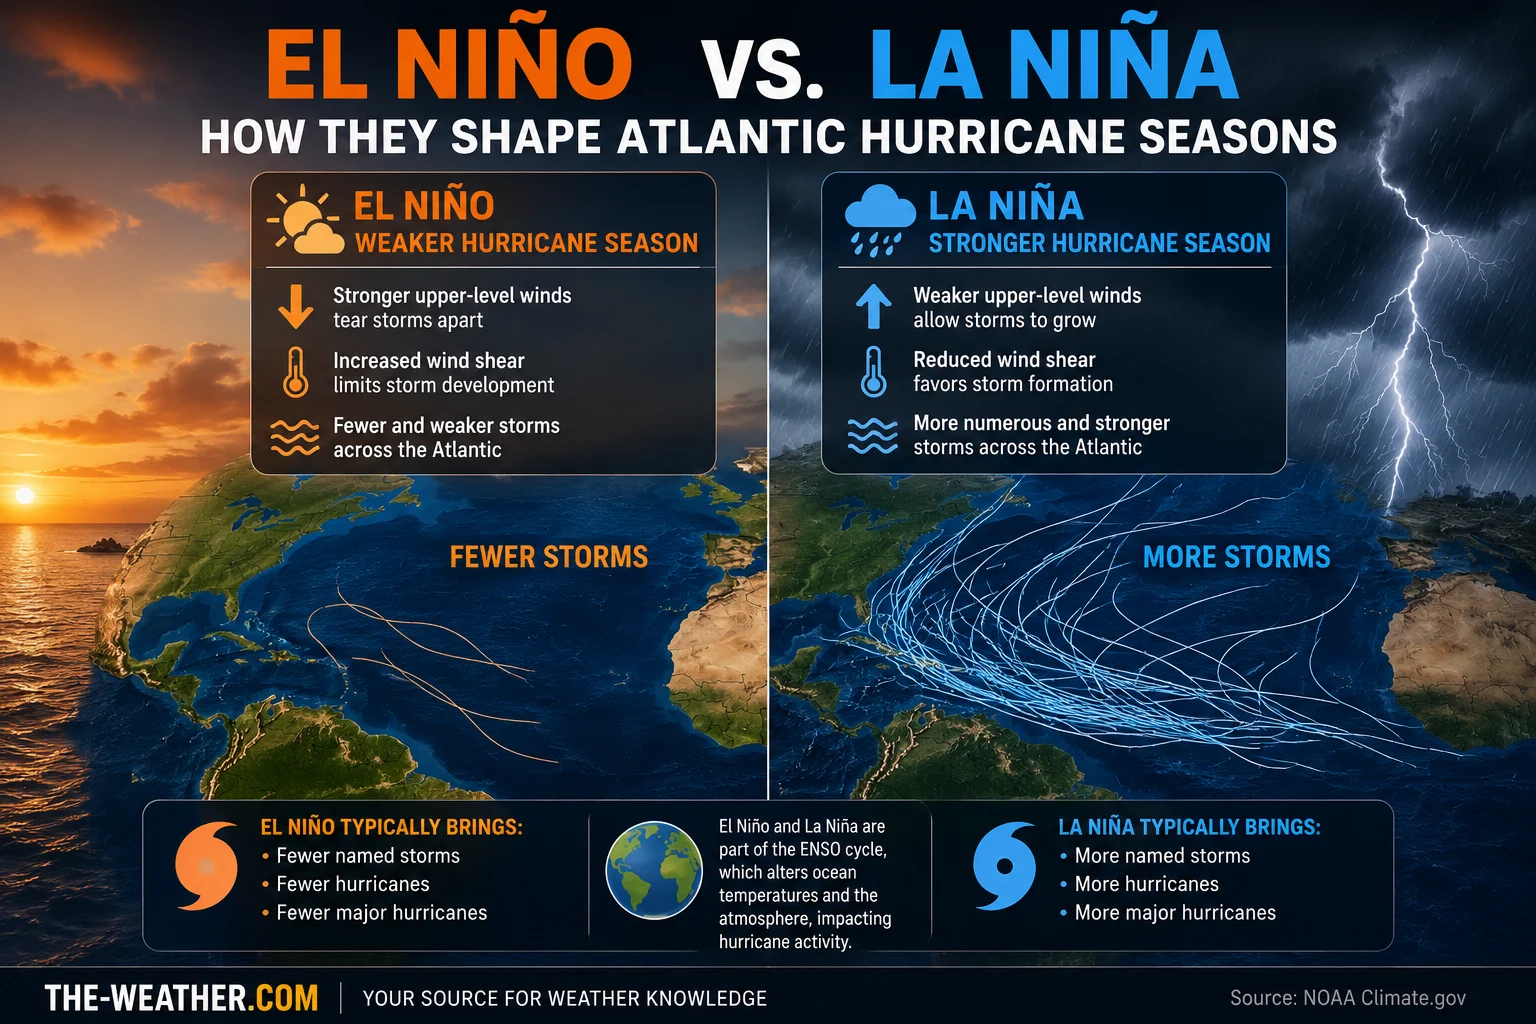
| 2002-03 | Jun 2002–Feb 2003 | +1.3°C | Moderate | Severe Australian drought · below-normal Atlantic hurricane season |
| 1991-92 | Jun 1991–Jun 1992 | +1.7°C | Strong | Complicated by Pinatubo eruption cooling · California drought then flooding · US hurricane season below normal |
| 1987-88 | May 1987–Jun 1988 | +1.6°C | Strong | Drought in Australia · drier US West · Atlantic hurricane season below normal |
| 1965-66 | May 1965–Apr 1966 | +1.8°C | Strong | Drought in India and sub-Saharan Africa · flooding in Peru |
| 2026-27 ⚡ DEVELOPING | Jun 2026–? | +2.0°C+ forecast | Very Strong (forecast) | Below-normal 2026 Atlantic hurricane season · US winter impacts pending peak |
Sources: NOAA CPC Oceanic Niño Index historical records · NOAA NCEI event summaries · MRCC/Purdue ENSO indices. ⚡ 2026-27 row reflects forecast, not observed data.
New to terms like ONI and Niño 3.4? Our ENSO guide explains how El Niño is measured and what the three phases are.
The Three Benchmark Events: In Detail
The 2015-16 event surpassed 1997-98 in raw peak SST anomaly, recording the highest ONI value in the modern instrumental record. It drove severe drought across southern Africa, leaving tens of millions facing food insecurity. Indonesia experienced an extended dry season during which peat fires released carbon equivalent to Japan's annual emissions. Southern California received more than 150% of normal winter rainfall in some areas, triggering floods and landslides in fire-scarred terrain. The temporary warming pulse it added to an already-warming baseline helped push 2016 to a new global temperature record at the time.
The 1997-98 event is considered the benchmark of El Niño's destructive potential. It developed unusually rapidly, from neutral conditions to +2.0°C within six months, catching forecasters and communities off guard. California experienced catastrophic mudslides. Indonesia and Malaysia suffered severe drought, driving wildfires that blanketed Southeast Asia in smoke. The Peruvian anchovy fishery essentially collapsed as warm water suppressed the cold upwelling the anchovy depend on. Coral bleaching occurred on an unprecedented scale across the tropical Pacific. According to NOAA's National Centers for Environmental Information, an estimated 23,000 deaths have been attributed to the event worldwide, and roughly $35 billion in damage was recorded globally, though attribution of deaths to complex weather events involves inherent uncertainty.
The 1982-83 event is historically significant not just for its intensity but for how completely it was missed by forecasters at the time. The ENSO observing network that now provides months of advance warning did not yet exist. The event emerged rapidly, catching both the scientific community and governments unprepared. The resulting drought in Australia, flooding in Peru and Ecuador, and global agricultural disruption, estimated at $4 to $8 billion in damage, provided the political impetus to build the TAO/TRITON ocean buoy array that now forms the backbone of real-time ENSO monitoring. The event accelerated the development of today's global ENSO observing and forecasting systems.
The 2026-27 Event: Where It Stands
As of July 2026, the developing El Niño is tracking faster than either the 1997-98 or 2015-16 events at the same stage. The Niño 3.4 index surpassed +1.7°C by mid-June and was still rising. Some ensemble scenarios indicate the possibility of the event reaching +3.0°C or higher by autumn, which would exceed all previous ONI records. High-end scenarios in some models project even higher values: territory that would have no modern analogue. These are not confirmed forecasts and carry significant uncertainty at this lead time.
For comparison, a subsurface temperature anomaly of +8°C at 100 to 150 metres depth was recorded propagating east across the equatorial Pacific in late May 2026: warmer at that stage than the equivalent measurements for both 1997-98 and 2015-16. This subsurface heat content provides the fuel that will sustain the event through autumn and winter. See our Super El Niño 2026 tracker for the latest data as it is published.
How Scientists Rank El Niño Events
Ranking El Niño events by strength sounds straightforward, but it depends significantly on which dataset and methodology you use. This is why you will occasionally see different sources give slightly different peak values or rankings for the same event.
The Oceanic Niño Index (ONI)
NOAA's Climate Prediction Center uses the ONI as its primary operational metric: the 3-month running average of sea surface temperature anomalies in the Niño 3.4 region (5°N–5°S, 170°W–120°W), calculated using the ERSSTv5 dataset and updated every 5 years against a new 30-year climatological baseline. All peak values cited on this page use the ONI. Under this metric, 2015-16 holds the record at +2.6°C, followed by 1997-98 at +2.3°C and 1982-83 at +2.2°C.
Why datasets sometimes disagree
The ERSSTv5 dataset used for the ONI is a blended product that combines ship measurements, buoy readings, and satellite data. Earlier datasets, ERSSTv4 and ERSSTv3b, used slightly different methods for filling gaps in historical data, particularly in the pre-satellite era before 1979. This means the relative ranking of 1982-83 versus 1997-98 versus 2015-16 can shift slightly depending on which version of the dataset is used. NOAA's institutional repository notes that ranking shifts between these three events depending on which SST dataset analysts use.
The Multivariate ENSO Index (MEI)
The MEI, published by NOAA's Physical Sciences Laboratory, combines sea level pressure, sea surface temperature, surface winds, and outgoing longwave radiation into a single metric using bi-monthly seasons rather than 3-month averages. Under the MEI, the 1982-83 event ranks more strongly relative to other events than under the ONI alone. The MEI is considered a more complete representation of the coupled ocean-atmosphere state but is primarily used for research rather than operational forecasting.
The practical implication
For most purposes, comparing events, understanding impacts, following NOAA operational forecasts, the ONI is the right metric to use. It is the most widely cited, the most consistently updated, and the basis for all official NOAA El Niño and La Niña declarations. Where this page states a peak value, it is the ONI value from NOAA CPC records unless otherwise noted.
Related Topics
Frequently Asked Questions
What was the strongest El Niño ever recorded?
The 2015-16 El Niño holds the highest peak ONI value in the modern instrumental record at +2.6°C in November-December 2015. The 1997-98 event is the strongest of the 20th century at +2.3°C and produced the most documented global damage: an estimated 23,000 deaths have been attributed to the event and roughly $35 billion in damage recorded, per NOAA NCEI.
How does 2026 compare to past El Niño events?
As of July 2026, the developing event is already in strong territory with the Niño 3.4 index above +1.7°C and rising. ECMWF ensemble median projections reach +3.0°C by autumn, which would exceed all previous records. However, forecast uncertainty is high: the range spans from a moderate to potentially historic event. Subsurface heat content is tracking warmer than 1997-98 and 2015-16 at the equivalent stage.
What is a super El Niño?
Super El Niño is an informal term for events where the Niño 3.4 anomaly exceeds +2.0°C. It is not an official NOAA category: NOAA uses weak, moderate, strong, and very strong. Five events have crossed this threshold since 1950: 1972-73, 1982-83, 1997-98, 2015-16, and 2023-24.
How often do strong El Niño events occur?
Very strong events exceeding +2.0°C have occurred approximately five times since 1950, or roughly once every 15 years on average, though the timing is highly irregular. The interval between super El Niño events has ranged from 6 years (1997-98 to 2023-24 via 2015-16) to 25 years (1972-73 to 1997-98).
Track how the 2026-27 event compares to the historic events on this page as new data is published.
Sources
- NOAA CPC: Oceanic Niño Index historical records: all peak ONI values
- NOAA NCEI: Billion-dollar weather events: damage and casualty figures
- MRCC/Purdue: ENSO indices and past event records
- ECMWF: June-July 2026 ensemble projections for 2026-27 El Niño
No manufacturer compensation received. All historical ONI values from official NOAA CPC records. Damage figures from NOAA NCEI. 2026-27 forecast figures reflect ensemble projections as of July 2026 and are subject to revision.

Lena Thornton
Weather Station Analyst & CWOP Contributor. Lena researches ENSO history and climate data, tracking historic events using official NOAA and peer-reviewed sources. Updated July 2026.