
As an Amazon Associate, I earn from qualifying purchases.
In this article 9 sections
Why is Miami warm in January while Minneapolis sits around 16°F? And why is Seattle so much milder than Minneapolis, even though both are about the same distance from the equator? Latitude explains most of it. Oceans and land explain the rest. Here is how it works, with real climate charts made from NOAA data.
Short answer: the closer you are to the equator, the more directly the sun shines and the more energy each square foot of ground gets. NASA explains that toward the poles the sun's rays meet Earth at smaller and smaller angles, so the same light "gets spread over larger and larger surface areas". That is why low latitudes are warm and high latitudes are cold. But latitude is not the whole story: oceans, which heat and cool slowly, keep coastal places like Seattle milder than inland places like Minneapolis at almost the same latitude.
Editorial Research
- Written by
- Lena Thornton, Weather Station Analyst & CWOP Contributor
- Based on
- NASA Earth Observatory on Earth's energy budget, a NOAA Ocean Today lesson on land and water heating, and NOAA NCEI 1991-2020 U.S. Climate Normals for five airport stations (our own climographs)
- Research last verified
- October 24, 2026
Why Latitude Changes the Temperature
Shine a flashlight straight down on a table and you get a small, bright circle. Tilt it, and the same light spreads into a long, dim oval. Sunlight on Earth works the same way.
Near the equator, the midday sun is high in the sky and its light hits the ground almost straight on. Farther north or south, the sun is lower and the same beam is spread over more ground. NASA's Earth Observatory describes exactly this: at higher latitudes, sunlight meets Earth at smaller angles and is spread over larger areas. Less energy per square foot means cooler temperatures.
Seasons come from the same idea. Earth's tilt changes the sun angle through the year. In summer your hemisphere leans toward the sun, the sun climbs higher and the days are longer. In winter it is the other way around. The farther you are from the equator, the bigger that swing between summer and winter.
The Atmosphere and Oceans Move the Heat
Without some way to move heat around, the tropics would keep gaining heat and the poles would keep losing it. That does not happen, because, as NASA puts it, "the atmosphere and ocean work non-stop to even out solar heating imbalances". Winds, ocean currents, evaporation and rain carry heat from the tropics toward the poles. NASA calls this Earth's heat engine.
The big air masses that bring you cold snaps and warm spells are part of that heat transport. Read more in what is an air mass?
Five Climographs: Latitude in Real Data
A climograph (also called a climatogram) shows the climate of one place on a single chart: the average temperature for each month as a line, and the average precipitation as bars. It is the quickest way to "see" a climate. We made these five from NOAA's official 1991-2020 normals, ordered from south to north:
Climographs made by The-Weather.com from NOAA NCEI 1991-2020 U.S. Climate Normals (airport stations). Orange line: monthly average temperature (°F, left scale). Blue bars: monthly precipitation (inches, right scale).
What the charts show:
- Miami (25.8°N) has an almost flat orange line: warm all year, with a summer rainy season.
- Phoenix (33.4°N) is hot, but look at the bars: only about 7 inches of rain a year. Latitude sets the warmth; a desert location sets the dryness.
- Minneapolis (44.9°N) has the biggest swing: a normal January of 16.2°F and a normal July of 74.3°F, a difference of 58°F.
- Seattle (47.4°N) is even farther north than Minneapolis, yet its swing is only about 25°F, and its wet season is winter, not summer.
- Anchorage (61.2°N) is the coldest overall, with a normal July of only 59.6°F.
Same Latitude, Different Climate: Seattle vs Minneapolis
Seattle and Minneapolis are a good test, because they are only a few degrees of latitude apart. Their climates are very different:
| Seattle, WA (47.4°N) | Minneapolis, MN (44.9°N) | |
|---|---|---|
| Normal January | 42.8°F | 16.2°F |
| Normal July | 67.1°F | 74.3°F |
| Swing January to July | about 25°F | about 58°F |
| Wettest month | November | June |
NOAA NCEI 1991-2020 U.S. Climate Normals.
The difference is water. A NOAA Ocean Today lesson explains that land and water absorb and release heat differently, and that the ocean moderates the climate of coastal places. Its example is San Francisco, where average temperatures change little over the year, against inland Sacramento, which is cooler in winter and warmer in summer. Seattle and Minneapolis show the same pattern: Seattle gets its air from the Pacific, while Minneapolis sits in the middle of a continent, where the land heats up fast in summer and cools down fast in winter. These two types are often called a maritime and a continental climate.
Other Things That Shape Climate
- Elevation: higher places are usually cooler than low places at the same latitude.
- Mountains: they can block moist air, leaving one side wet and the other side dry.
- Ocean currents: warm and cold currents carry heat along coasts, part of the heat engine described above.
- Your own backyard: pavement, hills and trees make small local differences. See local weather differences and microclimates.
Make a Climograph for Your Own Town
You can make one yourself. NOAA's NCEI publishes the 1991-2020 normals for thousands of U.S. stations. Look up the monthly average temperature and precipitation for the station nearest to you, then draw 12 bars for precipitation and a line for temperature. If you have a home weather station with a few years of data, you can compare your backyard to the official normals. That is the moment weather turns into climate. Our page on weather vs climate explains the difference.
Latitude and Climate FAQ
How does latitude affect climate?
Latitude sets how directly sunlight hits the ground. Near the equator the sun is high and its energy is concentrated; toward the poles the same sunlight is spread over a larger area. That makes low latitudes warmer and high latitudes colder, with bigger seasonal swings.
Why are places at the same latitude so different?
Oceans, mountains and elevation. Water heats and cools slowly, so coastal places like Seattle have milder winters and cooler summers than inland places like Minneapolis at almost the same latitude.
What is a climograph?
A chart that shows the climate of one place: average monthly temperature as a line and average monthly precipitation as bars. It is also called a climatogram.
Does climate affect latitude?
No. Latitude is a fixed position on Earth, measured from the equator. It works the other way around: latitude is one of the main things that shape climate.
Update Log
- October 24, 2026: First version, with five climographs from NOAA 1991-2020 normals.
Sources
- NASA Earth Observatory: Climate and Earth's Energy Budget
- NOAA Ocean Today: Lesson 3, land and water heating
- NOAA NCEI: U.S. Climate Normals (1991-2020 monthly normals for stations USW00012839, USW00023183, USW00014922, USW00024233 and USW00026451, retrieved October 24, 2026)
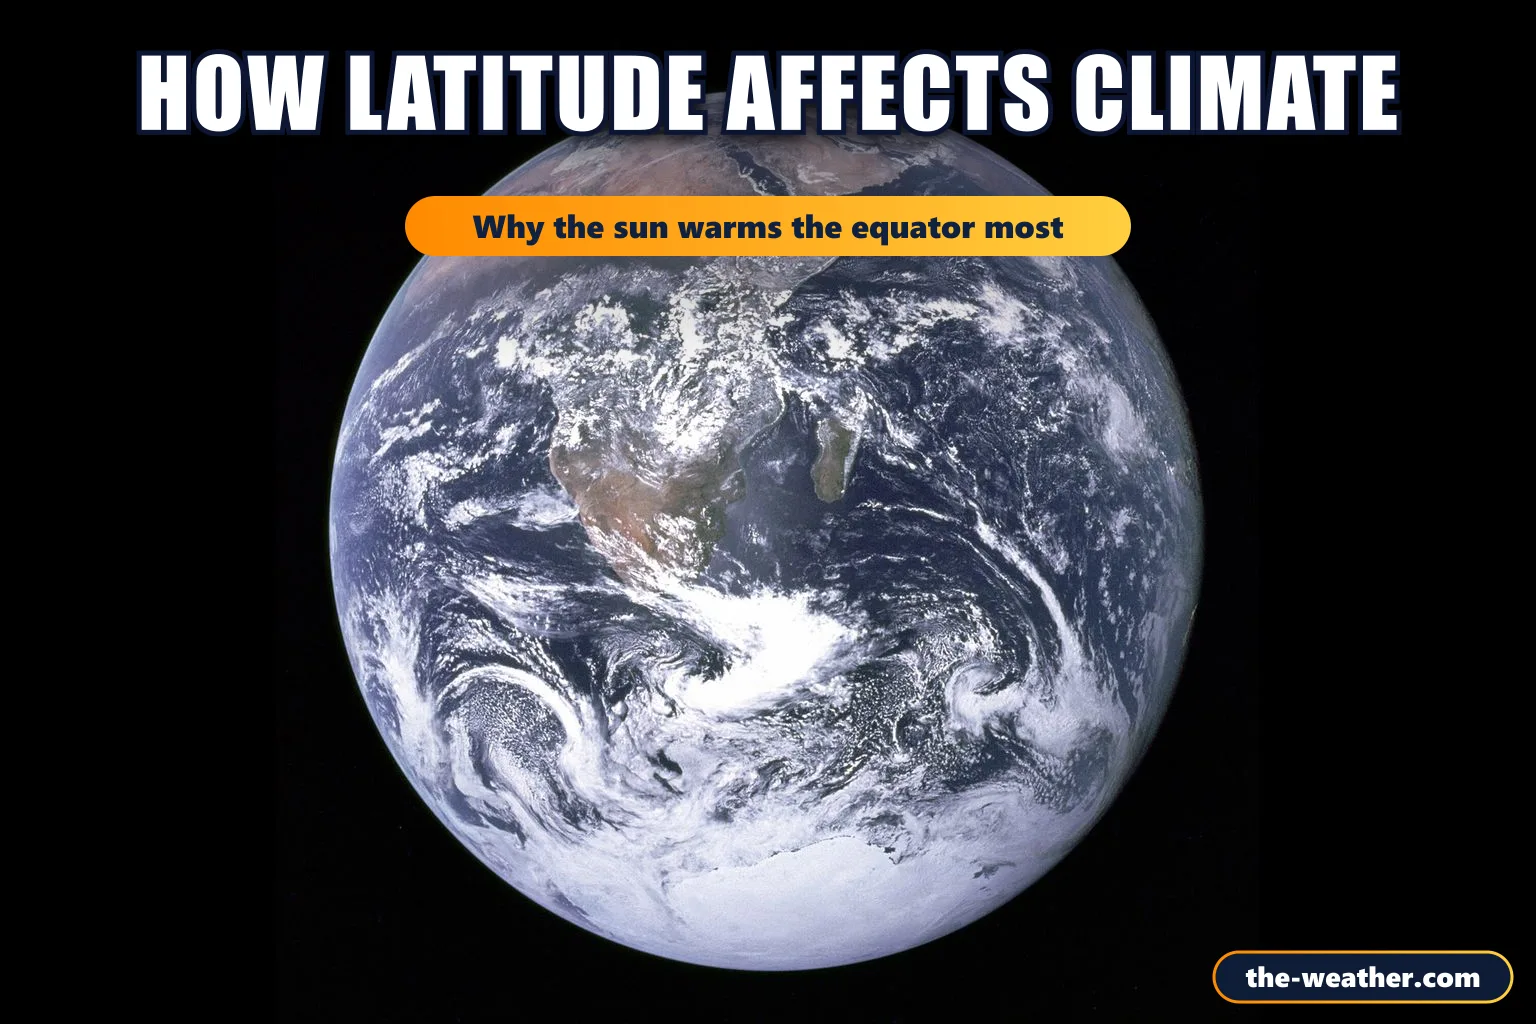
- Photo: NASA: The Earth seen from Apollo 17, public domain, via Wikimedia Commons
More weather basics: Weather vs climate · What is an air mass? · The hottest place on Earth