
As an Amazon Associate, I earn from qualifying purchases.
In this article 5 sections
The short answer: Three metrics matter most when severe weather approaches: barometric pressure trend, wind speed against official NWS thresholds (39 mph tropical storm, 74 mph hurricane), and rainfall rate rather than daily total. A home weather station tracking all three, paired with a NOAA weather alert radio for official warnings, gives you the clearest local picture available.
- Barometric pressure trend, not absolute value, is the earliest warning sign
- NWS triggers a Tropical Storm Warning at 39 mph sustained winds and a Hurricane Warning at 74 mph
- Rainfall rate per hour matters more than daily total for flash flood risk
- S.A.M.E. programming on a NOAA weather radio ensures alerts are specific to your county
- A home weather station complements but never replaces official NWS warnings
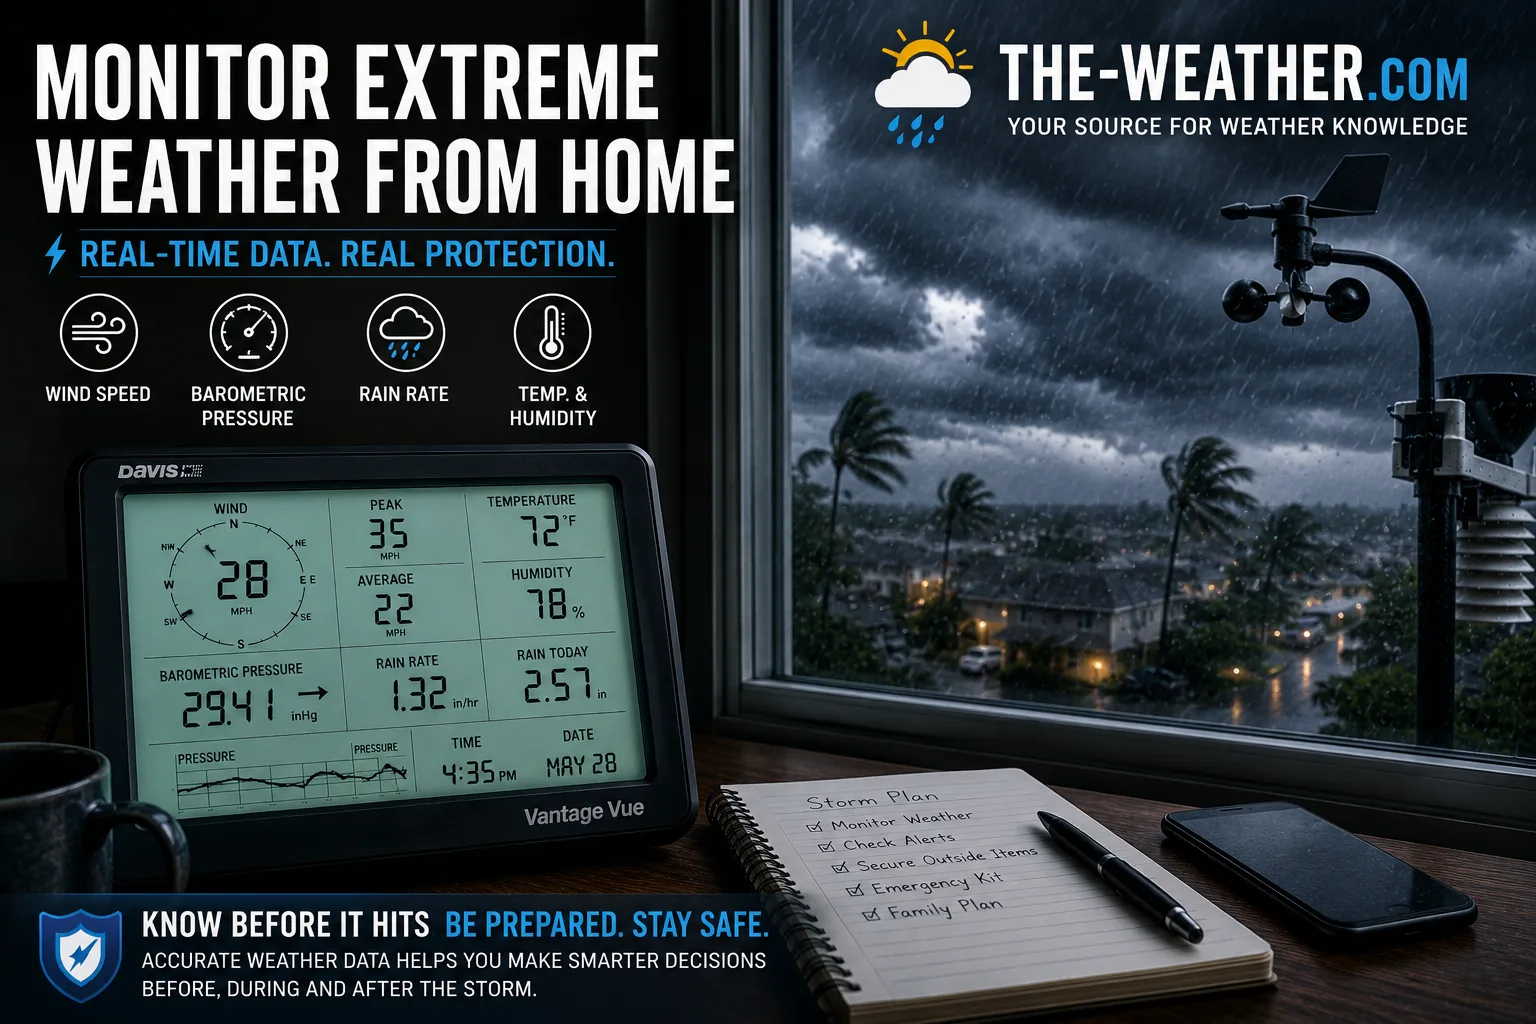
Tracking pressure, wind, and rainfall together, not any single metric alone, gives the clearest local picture as severe weather approaches.
This page covers the specific thresholds that matter, how to set up alerts around them, and how to read your weather station and NOAA radio together rather than treating either as a complete picture on its own.
The Three Metrics That Matter Most

Keep this reference handy: these are the specific numbers, not vague impressions, that indicate genuine risk.
Storm spotters and meteorologists watch a falling barometric pressure trend, increasing sustained wind speeds and gusts, and rapid changes in rainfall intensity as a tropical system approaches. These three indicators, tracked together, give the clearest local picture before and during landfall.
Each metric tells you something different. Pressure shows you the system's overall strength and trajectory hours in advance. Wind shows you current conditions and how rapidly they're escalating. Rainfall rate shows you immediate flooding risk, which is often more dangerous than wind for inland areas.
Setting Up Your Monitoring System
Set up barometric pressure monitoring
Install your weather station console where you can check the pressure trend display regularly. Note the typical pressure range for your location over a few weeks of normal weather, so you recognise what a meaningful departure looks like.
Position your wind sensor correctly
Mount your anemometer at the height and clearance recommended in your station's manual, away from buildings, trees, and other obstructions that would distort readings. An inaccurately placed wind sensor gives you false confidence in either direction.
Know the official thresholds so you can interpret your own readings against the same scale the National Weather Service uses:
| Sustained wind speed | NWS classification | What it means |
|---|---|---|
| Under 39 mph | Below warning threshold | Standard storm conditions |
| 39–73 mph | Tropical Storm Watch/Warning | Issued when threat is possible (Watch) or expected within 36 hrs (Warning) |
| 74 mph and above | Hurricane Watch/Warning | Watch issued 48 hrs ahead, Warning issued 36 hrs ahead of expected onset |
| 111 mph and above | Extreme Wind Warning | Short-fused warning for imminent extreme winds: equivalent to Category 3+ |
Thresholds per official NWS Watch/Warning/Advisory criteria. These are sustained wind speeds, not gusts.
Configure rainfall rate alerts
Most weather station apps allow you to set custom alert thresholds. Configure an alert for rainfall rate per hour, not just your daily total: a high rate sustained over even 30 minutes can produce flash flooding regardless of what the full-day total eventually shows.
Program your NOAA weather alert radio
Enter your county S.A.M.E. code so your radio only sounds for warnings affecting your specific area. This ensures you receive official National Weather Service alerts independent of internet availability or cellular network status: critical during the exact conditions when both are most likely to fail. See our Midland weather radio setup walkthrough for the full S.A.M.E. programming process.
Establish your monitoring routine
Check pressure trend, wind speed, and rainfall rate together during active weather, not any single metric in isolation. A falling pressure with calm winds means a system is still approaching. Rising winds with stable pressure may indicate a passing squall rather than a sustained system. The combination, read together, is what gives you genuine situational awareness.
What Each Metric Actually Tells You
The earliest indicator, often visible hours before wind or rain change noticeably. Shows a low-pressure system is strengthening or approaching your location.
Shows current intensity at your exact location and how rapidly conditions are escalating as a system arrives or passes.
A classic storm-tracking technique: direction changes can indicate a system's track relative to your position as it moves.
The most direct real-time indicator of flash flood risk: more immediately relevant to inland flooding than wind speed in many cases.
Equipment for Complete Monitoring
A complete home monitoring setup pairs a weather station tracking the three core metrics with a NOAA weather alert radio for official warnings.
Tracks pressure, wind, and rainfall together with lightning detection included in the 01001M bundle: a genuinely complete local monitoring picture in one station.
Covers the same three core metrics at a lower price point with Weather Underground integration for community data comparison.
S.A.M.E. county programming delivers official NWS warnings independent of internet and cellular networks: the essential complement to any home weather station.
Frequently Asked Questions
What barometric pressure drop indicates a storm?
A sustained drop of more than 0.06 inHg per hour over several hours is a meaningful warning sign. Rapid drops of 0.18 inHg or more in 3 hours are associated with rapidly intensifying systems. The rate of change matters more than the absolute pressure value.
What wind speed triggers a hurricane warning?
Per official NWS criteria, sustained winds of 39 to 73 mph trigger a Tropical Storm Warning. Sustained winds of 74 mph or higher trigger a Hurricane Warning. These thresholds refer to sustained winds, not gusts.
What rainfall rate indicates flash flood risk?
There is no single universal threshold since risk depends on local terrain, soil saturation, and drainage. As a general reference point, rates exceeding 1-2 inches per hour sustained for 30+ minutes warrant attention. Always follow official NWS flash flood warnings rather than a fixed personal threshold.
Can a home weather station replace official NWS warnings?
No. A home weather station provides hyper-local real-time data that complements official warnings but should never replace them. NWS forecasters have radar, satellite, and broader atmospheric data your home station cannot capture. Always follow official watches and warnings.
Track the developing El Niño event and what it means for this year's hurricane season.
Full comparison of stations built for tracking the metrics covered on this page.
Sources
- NWS Watch/Warning/Advisory Criteria: Official wind speed threshold definitions
- NOAA AOML: Hurricane classification and wind speed reference
- National Hurricane Center: Saffir-Simpson Hurricane Wind Scale official documentation
Pressure drop guidance based on common meteorological reference ranges. Rainfall rate guidance is general, always follow official NWS flash flood warnings for your specific area. No manufacturer compensation received.

Lena Thornton
Weather Station Analyst & CWOP Contributor. Lena translates official NWS criteria and weather station data into practical home monitoring guidance. Updated June 2026.